


普罗米修斯下载网址:https://prometheus.io/download/
监控集成器下载地址:http://www.coderdocument.com/docs/prometheus/v2.14/instrumenting/exporters_and_integrations.html
主服务器配置
安装
wget https://github.com/prometheus/prometheus/releases/download/v3.5.0-rc.0/prometheus-3.5.0-rc.0.linux-amd64.tar.gz
tar xf  prometheus-3.5.0-rc.0.linux-amd64.tar.gz -C /usr/local
mv prometheus-3.5.0-rc.0.linux-amd64/ /usr/local/prometheus
查看版本号
cd /usr/local/prometheus
./prometheus --version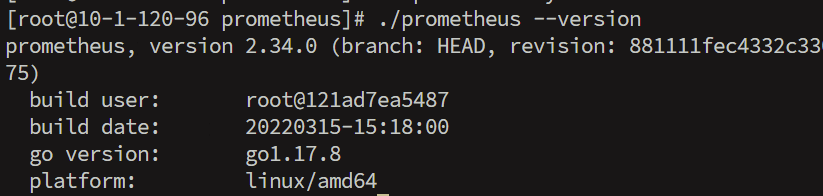
帮助文档
./prometheus --helpprometheus.yml 配置解释
# my global config
global:
  # 默认情况下,每15s拉取一次目标采样点数据。
  scrape_interval:     15s # Set the scrape interval to every 15 seconds. Default is every 1 minute.
  # 每15秒评估一次规则。默认值为每1分钟。
  evaluation_interval: 15s # Evaluate rules every 15 seconds. The default is every 1 minute.
  # scrape_timeout is set to the global default (10s).

# Alertmanager configuration
alerting:
  alertmanagers:
  - static_configs:
    - targets:
      # - alertmanager:9093

# Load rules once and periodically evaluate them according to the global 'evaluation_interval'.
rule_files:
  # - "first_rules.yml"
  # - "second_rules.yml"

# A scrape configuration containing exactly one endpoint to scrape:
# Here it's Prometheus itself.
scrape_configs:
  # job名称会增加到拉取到的所有采样点上,同时还有一个instance目标服务的host:port标签也会增加到采样点上
  - job_name: 'prometheus'

    # 覆盖global的采样点,拉取时间间隔5s
    scrape_interval: 5s
    static_configs:
    - targets: ['localhost:9090']
启动服务
./prometheus --config.file=prometheus.yml访问 http://localhost:9090
将Prometheus配置为系统服务
cd /usr/lib/systemd/system
vim prometheus.service
增加以下信息
[Unit]
  Description=https://prometheus.io

  [Service]
  Restart=on-failure
  ExecStart=/usr/local/prometheus/prometheus --config.file=/usr/local/prometheus/prometheus.yml --web.listen-address=:9090

  [Install]
  WantedBy=multi-user.target
启动生效
systemctl daemon-reload
systemctl start prometheus
客户端
客户端安装node_exporter
wget http://blog.koniaoer.top/upload/node_exporter-1.9.1.linux-amd64.tar.gz
tar xf node_exporter-1.9.1.linux-amd64.tar.gz -C /usr/local/
cd /usr/local/
mv node_exporter-1.9.1.linux-amd64/ node_exporter
cd node_exporter
启动并添加服务
./node_exporter &
vim /usr/lib/systemd/system/node_exporter.service
# 启动后会监听9100端口
添加以下数据
[Unit]
Description=node_exporter
After=network.target

[Service]
ExecStart=/usr/local/node_exporter/node_exporter
Restart=on-failure
Restart=always
RestartSec=5s

[Install]
WantedBy=multi-user.target
# 启动node_exporter
systemctl daemon-reload
systemctl start node_exporter根据以下格式在主服务器的prometheus.yml文件增加客户端ip:port
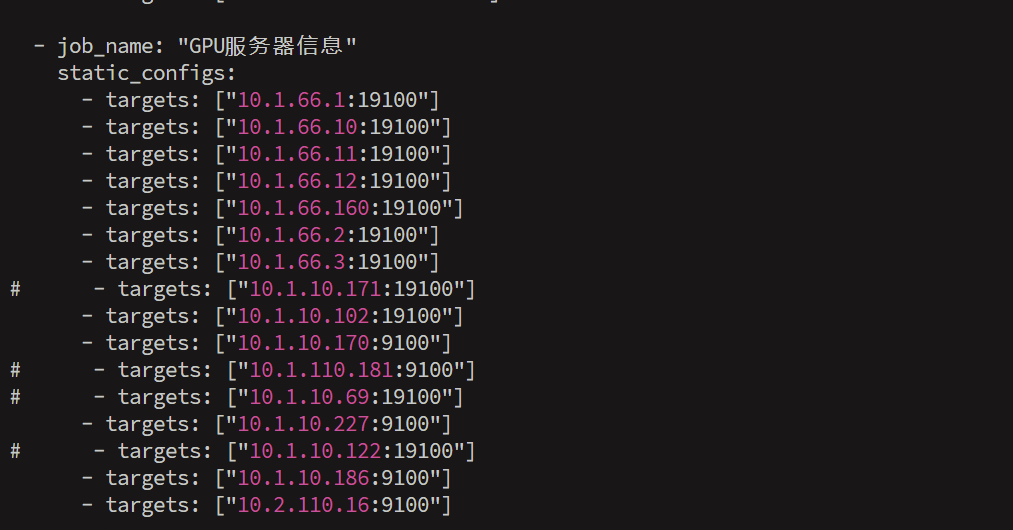
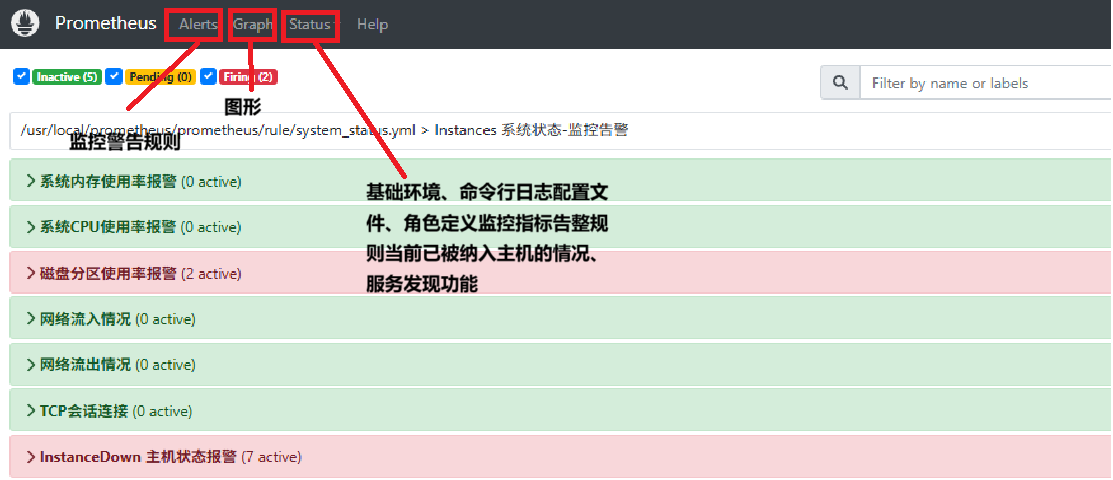
systemctl restart prometheus.service打开普罗米修斯自带的监控页面,Status -> Targets 查看:
监控MySQL
wget https://github.com/prometheus/mysqld_exporter/releases/download/v0.17.2/mysqld_exporter-0.17.2.linux-amd64.tar.gz
tar xf mysqld_exporter-0.17.2.linux-amd64.tar.gz -C /usr/local/
cd /usr/local/
mv mysqld_exporter-0.17.2.linux-amd64 mysqld_exporter
cd /usr/local/mysqld_exporter
vim .my.cnf
[client]
user=root
password=123456启动mysqld-exporter
./mysqld_exporter --config.my-cnf="/usr/local/mysqld_exporter/.my.cnf" &检查端口,查看是否启动
ps -ef |grep exporter
ss -lntp |grep 9140
在Prometheus配置文件增加监控项
vim prometheus.yml
  - job_name: 'mysql'
    static_configs:
    - targets: ['改成客户端ip:9104']
重启
systemctl restart prometheus.service将宿客户端采集node_exporter加入到服务配置文件中
vi /usr/lib/systemd/system/node_exporter.service[Unit]
Description=https://prometheus.io
[Service]
Restart=on-failure
ExecStart=/usr/local/node_exporter/node_exporter --collector.systemd --collector.systemd.unit-whitelist=(docker|sshd|nginx).service
[Install]
WantedBy=multi-user.targetGrafana 展示 Prometheus 数据
wget https://mirrors.tuna.tsinghua.edu.cn/grafana/yum/rpm/grafana-7.4.3-1.x86_64.rpm
yum install initscripts fontconfig
yum install -y grafana-7.4.3-1.x86_64.rpm
systemctl status grafana-server.service
启动后访问地址:ip:3000
初始用户名和密码都是admin
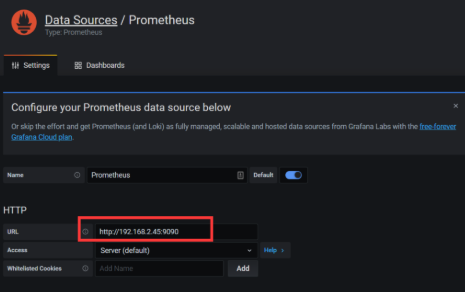
添加Prometheus数据源
Configuration -> Data Sources ->add data source -> Prometheus
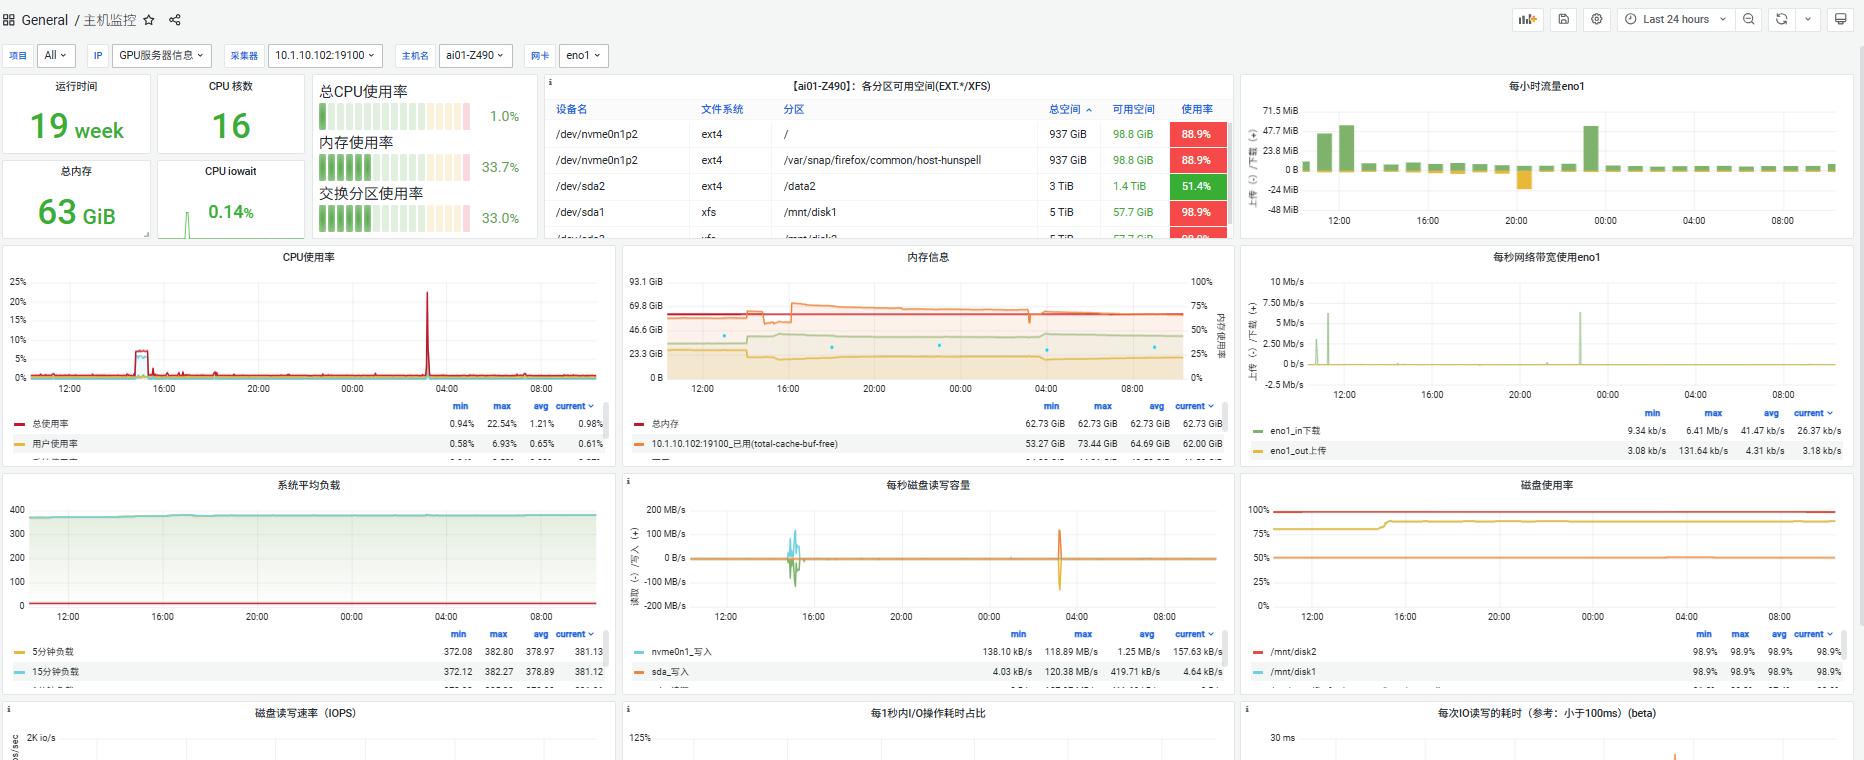
新增Dashboard Linux基础数据展示
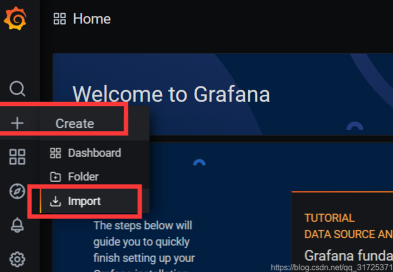
后输入自己喜欢的模板的代码
grafana模板: https://grafana.com/grafana/dashboards
这里我用的1233
评论区